Worldwide studies indicate correlation between Research and Development (R&D) and national prosperity. R&D spending could be used as sustainable stimulus to revive an economy. Trends of R&D as a percentage of GDP in TUNISIA and relative to other peer countries are presented in this chart. As reported by the World Bank, from 1996 to 2009 Tunisia R&D spending went from 0.3% to 1.1%. While similar trends were noticed for MENA countries such as Egypt, Morocco, Saudi Arabia, and Turkey, the rates remained noticeably low relative to advanced countries
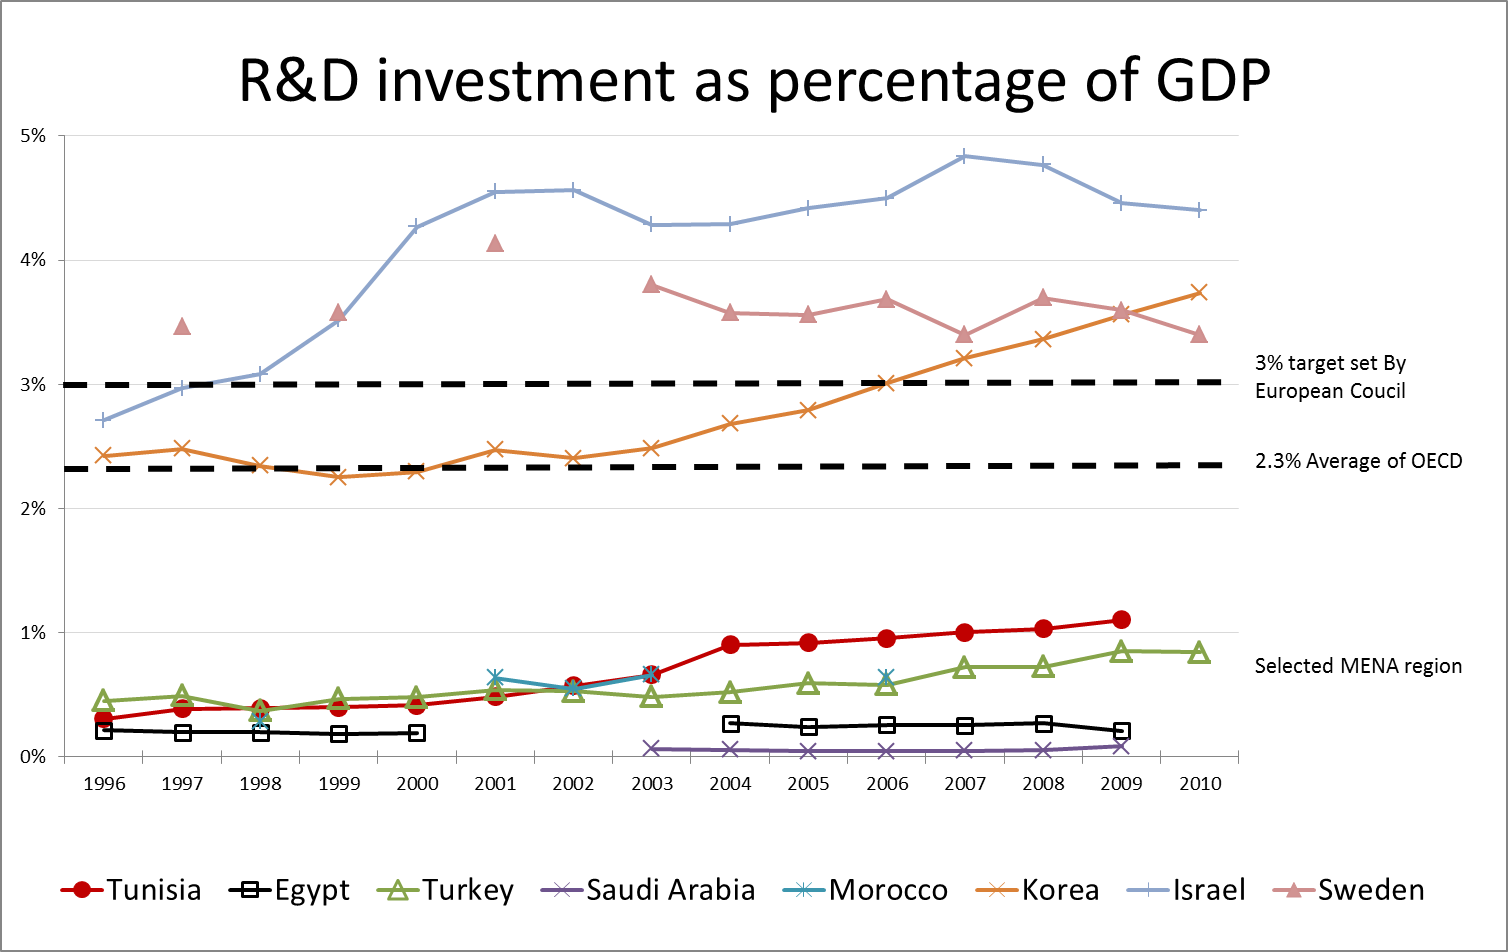
Based on a sample of the 23 OECD members, countries like Denmark, Finland, Israel, Japan, South Korea, Sweden, and Switzerland have an R&D spending to GDP ratio over 3% and the overall average for OECD countries is 2.3%. In 2002 the European Council set a target R&D to GDP ratio of 3% as reported by Guy and Guy [1].
There are attempts by leading consulting firms such as Boston Consulting Group to financially model the return on investment (ROI) of R&D spending. Those models are beyond the scope of this note. Rather, we will just briefly mention the great Sequencing of Human Genome R&D projects that took place in the US. To our knowledge the Human Genome Project (ROI is 141: 1), cost between 1990 and 2003 roughly $3.8 billion, and generated an economic impact of $796 billion (the details are provided in Gitlin[2]).
The impact of R&D spending is of great interest and could generate tangible (i.e. revenue, exports, jobs, etc…) and intangible (i.e., patents, publications, awards). In the case of Tunisia, Missaoui [3] showed a clear high positive correlation between the increase in high tech export and the increase in R&D as a % of GDP spending. Amrouche [4] indicated that TUNISIA is a Dynamic Adopter country with a Technology Achievement Index (TAI) of 0.4. The TAI is intangible and used by many institutions worldwide in performance and decision matrices when big projects and finance opportunities are awarded.
It is interesting to note that R&D as % of GDP includes both public and private sector. The European council targeted 1/3 funding from the public sector and 2/3 funding from private firms. Just for illustration purposes, in Switzerland, Novartis, and Roche, spent approximately $9.6B and $9.4B or 16.4% and 19.6% of sales on R&D in 2011, respectively. Unfortunately in Tunisia, the private firm size distribution (a topic of future discussion), is skewed toward medium size (200 employee or less) and micro (2 employee) size enterprise. Large firms are mainly government-owned. With the current private enterprise size distribution, it will be very difficult for the private sector to contribute to the R&D process unless major mergers and acquisitions take place.
Many recommendations could be made to stimulate R&D investments in Tunisia some of which are direct such as providing research project grants and others indirect such as providing tax incentives. Different countries have different structures and platforms overseeing R&D spending such as Australia R&D groups reporting directly to the parliaments. Others tend to channel R&D through ministries. Regardless of the platform utilized, Tunisia exhibits, relative to leading countries, substantially low R&D investment metrics. These modest indicators continue to limit its long run development potential.
Note prepared by Zied Driss TUNESS Research Team
Refrences:
1 Ken Guy, Wise Guy, Designing the policy Mixes Enhancing Innovation Systems Performance and R&D Investment Level, 2009.
2 Jonathon Max Gitlin, calculating the economic Impact of the Human Genome Project, 2013.
3 Oualid Missaoui, Does Tunisia Export High-Tech? TUNESS, May 25, 2013.
4 Nawel Amrouche, Assessment of Science and Innovation in Tunisia. TUNESS, June 01, 2013.
Data Source: World Bank