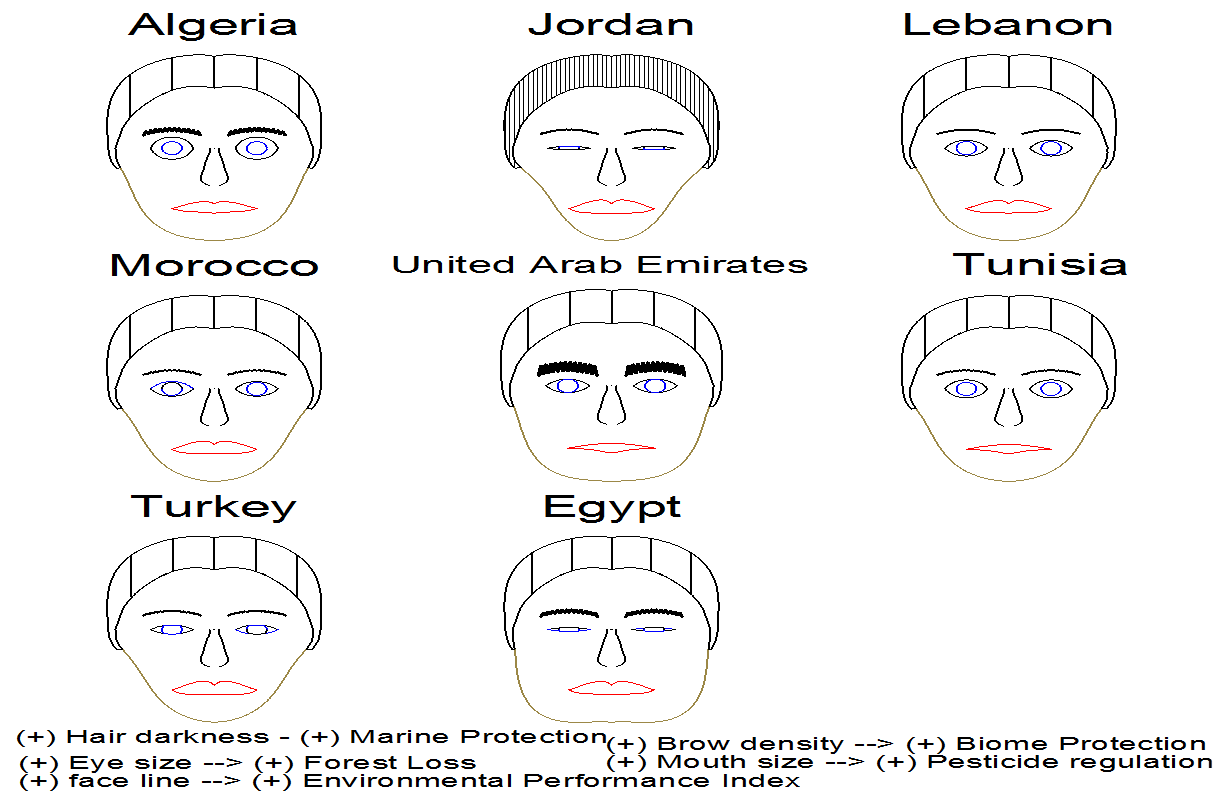
This week we study a selection of indicators capturing the Environmental Performance of certain MENA countries. Our goal is review how well countries succeed in reducing environmental stresses on human health and promoting ecosystem vitality and sound natural resource management. We adopt an uncommon method (Chernoff Faces) which has been applied in several other fields. This method named after its creator (Chernoff, Department of Statistics, Stanford University; 1973, Journal of the American Statistical Association 68: 361–368) proposes the use of cartoon-like faces to represent points in k dimensions.
According to Rafal Raciborski (2009) the main use of face graphs was to enhance “the user’s ability to detect and comprehend important phenomena” and to serve “as a mnemonic device for remembering major conclusions”. Other advantages of faces as found in the literature is to monitor the sensitivity of variables to each other, to identify key differentiating dimensions, and/or to detect longitudinal trends. Five distinct indicators are studied in this note and are all derived from the database compiled by Environmental research Centre at Yale for the year 2010. These indicators are; (a) the loss of forest area owing to deforestation from either human or natural causes, such as forest fires; (b) The percentage of economic zone (0-200 nautical miles) that are under protection by a marine protected area (MPA); (c) Biomes under protected status; (d) level of compliance with certain International Conventions (Stockholm Convention) limiting the use of toxic chemicals; (e) and an overall performance index derived from 22 separate indicators.
As can be seen above, it appears that the overall environmental performance (captured by the shape of face) of Tunisia is similar to its geographically neighboring countries (slightly below Egypt and UAE but with better performance than Turkey, Morocco or Jordan). Interestingly, the size of the eyes points to the fact that Tunisia has lost substantial parts of its forest land in the recent years and only Algeria seems to have done worse. All other countries included in this study have relatively limited such a degradation of the ecosystem. The same finding is replicated for the pesticide regulation and compliance with international convention (mouth size). Tunisia and UAE appear to be lagging behind all other countries. Notice that all countries (Jordan appears to lead the group) are found to exhibit quite similar marine protection for their respective nautical zones. Finally, with the exception of UAE which scored that highest in terms of Biome protection level, all the countries in the region appear not to enforce their national regulations to ensure this kind of protection as demonstrated by the density of the eyebrows.
In this weekly note we used a nonstandard method to look at how Tunisia is managing some of its natural resources, (relative to its neighbors), and how it struggles to ensure an exhaustive protection of key aspects of its ecosystem. Based on the analysis above the road ahead seems to be long to catch up (even) with our regional neighbors.
Data Source: Esty, D. C. et al. (2008) Environmental Performance Index. Yale Center for Environmental Law & Policy. http://epi.yale.edu/Home