TUNESS Chart of the Week (TCW), Friday Dec 28, 2012
The Industrial Production Index is widely used among scholars and policy makers to assess the economic prosperity of the country. Broadly speaking, this index measures the changes in the volume of the domestic output produced by the most important economic sectors in a given country (e.g., Mining, Manufacturing, Electrical energy...).
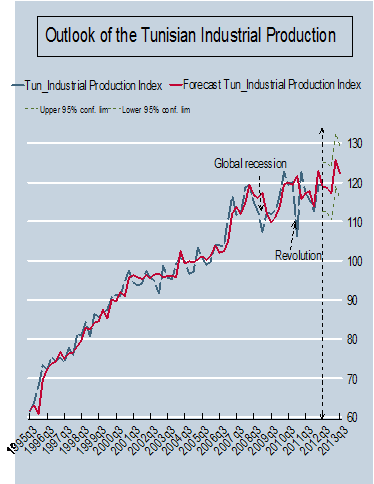
In Tunisia, this index has trended upward since 1995 with some breakpoints reflecting the cyclical movements of the business activity both at the national and global levels. We use a simple univariate autoregressive moving average (ARIMA) model to forecast the evolution of this index 5 periods (quarters) ahead*. The fitted model closely mimics the actual index movement over the recent period with two main exceptions during the latest global financial crisis and following the Tunisian revolution when the contraction of the economic activity was much more pronounced than anticipated given the dynamic of this series. According to the present model, we estimate that the downward trend in the current economic activity will continue over the next 2 or 3 quarters before it starts to pick up toward the end of 2013 as national industries continue to recover and comprehensive structural reforms (which continue to be postponed by local authorities) are implemented in several strategic sectors. One word of caution, any future political or social uncertainties and unrest will inevitably introduce additional noise into the model and thus reduce the accuracy of its predictive power.
* The full study of the Industrial Production Index in Tunisia will be published by TUNESS in the near future.
(Chart prepared by TUNESS Research Team)
Data source: IFS, IMF