TUNESS Chart of the Week (TCW), Monday April 08, 2013
Forecasting electric power consumption (EPC) is a crucial and essential activity to gauge electricity generation. The lack of a precise picture of the future may lead to over-capacity or shortages in power that can cause unexpectedly high costs. The attempts conducted to achieve such prediction could be classified into three types of forecasting: short-term (few minutes to few hours), medium-term (few months to few years), and long-term (5 to 25 years in the future).
Each type of forecasting is relevant in a given context. In fact, short-term forecasting is important for unit commitment, hydro-thermal coordination, load management, and all day-to-day operations of a utility. Medium-term forecasting is more necessary for planning fuel procurement, scheduling unit maintenance, inventory control/purchase of coal and liquid fuels, etc. Long-term forecasting is meant to be relevant for planning engineers to determine the type and size of new power installations. This type of forecasting couldn't be carried outside factors such as government policy and development decisions. In this study, we focus on medium-term forecasting of electric power consumption in Tunisia. In particular, we aim at modeling the yearly EPC. This choice is motivated by the lack of EPC high-frequency data. In fact, the only data we are aware of is the yearly EPC time series available from the World Bank and that spans over the period 1971-2010. In addition, long-term forecasting, as mentioned earlier, requires a close look at the governmental policy which is beyond the scope of this brief study.
Most forecasting models for medium-term EPC could be classified into two categories. They may be considered as times series (univariate) in which the consumption is modeled as a function of its past observed values. They also can model the EPC as a function of some exogenous factors, especially weather and socio-economic variables. We refer to the latter category as causal modeling.
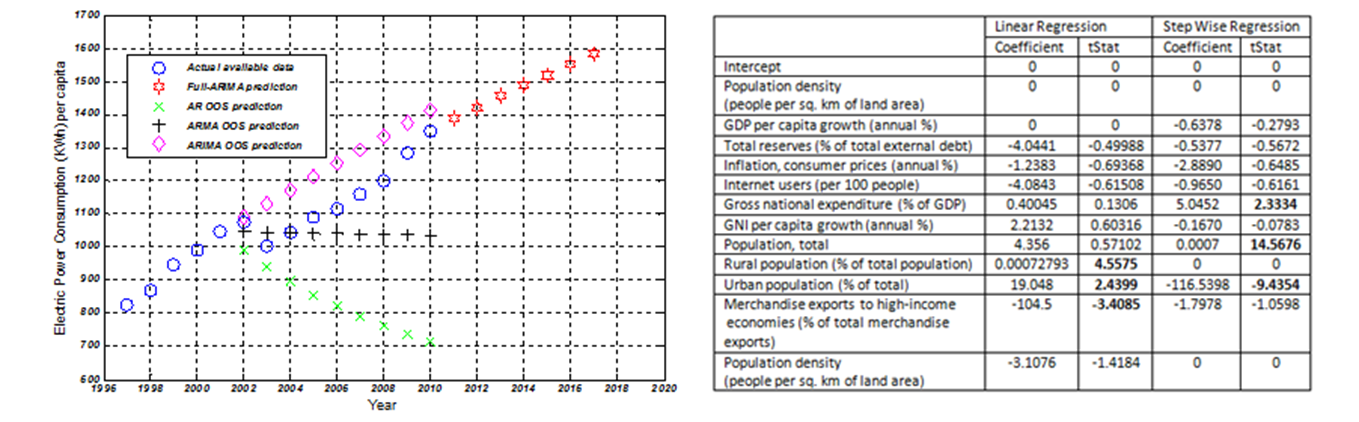
In this study, we investigate both modeling categories. For what concerns the univariate time series model, we fitted an AR, ARMA, and ARIMA(1) models. The data used to fit the three models ranges from 1971 to 2001. We have used the remaining values to assess the out-of-sample (OOS) performance and therefore perform the selection of the technique to be used to predict values beyond 2010. The performance metric used is the mean absolute percentage error (MAPE) that captures the average percentage deviation of the predicted value from the actual one. We found that the ARIMA model outperformed the other time series by a MAPE of 9% versus 10% and 25% for ARMA & AR respectively. This can easily be seen in the plot above. Next, and by fitting an ARIMA model to the entire time series (from 1971 to 2010), we were able to predict the trend of the EPC beyond 2010. In fact, a 2.8% increase in EPC from 2010 to 2011 was predicted. By the end of 2013, we expect the EPC to be 2.3% higher than which of 2012, i.e., 1454.038 kWh per capita.
For the causal category, we investigate a plain linear model, as well as a stepwise linear regression where the exogenous factors used, are mainly socio-economic variables as it may appear from the table above. This part of the study doesn't aim at correctly predicting the EPC or replacing/comparing with the time series modeling carried out above. It is rather meant to be an explorative step where we try to find predicting power in some socio-economic factors. The factors are purposely picked not to be directly related to EPC or any other form of energy. In particular, the aim is mainly to uncover hidden correlations between EPC and socio-economic factors. In this context, and among the 12 factors used, the aim is to distinguish the factors that have the most influence on the EPC. From the results displayed in the table, it is clear that both standard (ordinary least square OLS) and stepwise linear regressions do not fully agree about the most influential factors. In fact, the OLS regression analysis exhibit a positive influence for both rural and urban population percentages on the EPC, and a negative influence on the merchandise exports to high-income economies. However, the step-wise regression shows that the total population and the gross national expenditure have a significant positive influence on the EPC. Whereas the urban population is shown to be carrying a significant negative influence which contradicts the prediction of the OLS regression. These quick findings suggest a need for a deeper dive into the subject by: (a) investigating this mismatch, (b) considering a larger universe of factors, and (c) expanding the list of prediction techniques, to be compiled in a larger and thorough research paper following this study.
(1): AR=autoregressive, ARMA=autoregressive moving average, ARIMA=autoregressive integrated moving average
The reserach is conducted by Walid Missaoui, PhD, TUNESS Research team.
Data source: World Bank